Why Are Meme Coins So Volatile? Liquidity, Hype, and Bots
Why meme coins swing so sharply: understand thin liquidity, small market caps, hype cycles, concentrated holders, bots, and what slippage means for trades.
On this page
Disclosure: QuantBase is made by the team behind memecoin.buzz.
Risk: Most meme coins go to zero. Not financial advice.
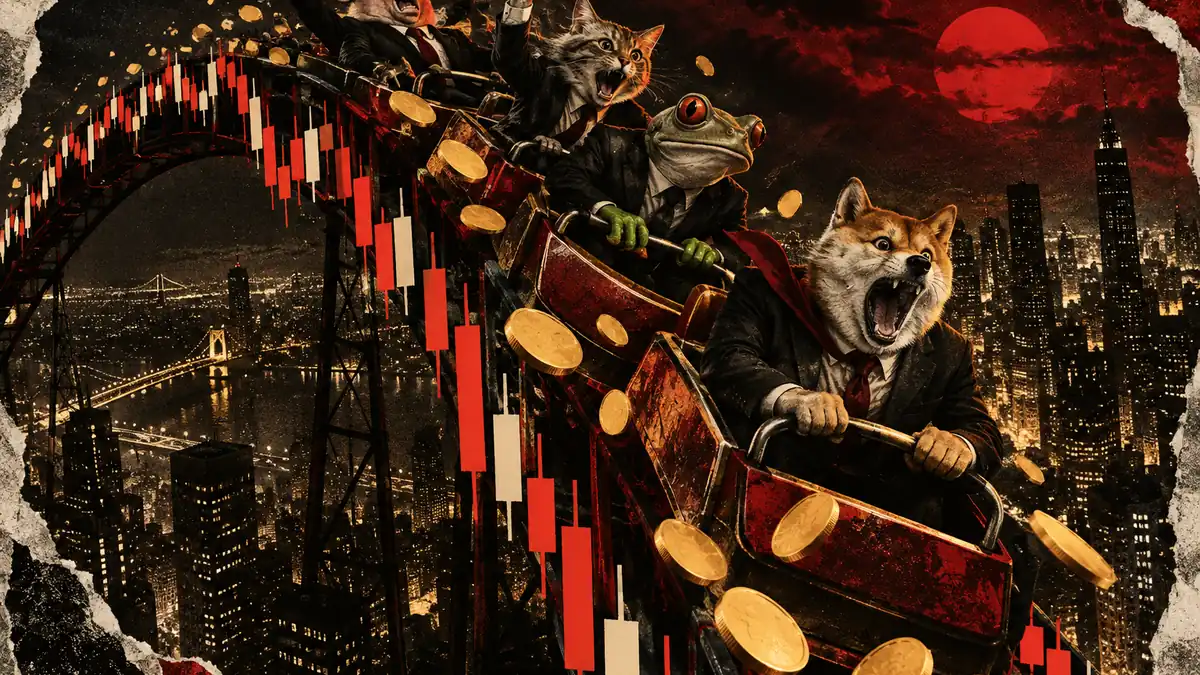
A meme coin can look quiet, attract a burst of attention, and suddenly produce a chart that resembles a mountain range. The joke has not necessarily changed. The balance between people trying to buy and people willing to sell has.
Why are meme coins so volatile? Several forces can stack together: thin liquidity, small market size, attention-driven demand, concentrated ownership, and automated trading. An order moves the price, that movement attracts attention, and the resulting rush can magnify the original move.
The useful distinction is between the story and the trading mechanics. A funny mascot explains why someone notices a coin. Liquidity and order flow—the buying and selling reaching the market—help explain what happens when they trade it.

Thin liquidity makes individual trades matter more
Volatility describes how much prices fluctuate over time. It concerns the variability of price movements, not simply whether a chart points upward or downward. A market can be volatile in either direction; the finance definition of volatility separates this variability from direction.
Liquidity is the ability to buy or sell without moving the price very much. In a liquid market, substantial trading interest can absorb an order. In a thin market, relatively little is available near the current price.
Imagine two stalls selling the same collectible. One has plenty of stock and a steady line of buyers; the other has a small tray and an occasional customer. A sudden crowd has a larger effect at the smaller stall. A rush to sell creates the reverse problem: too little buying interest to absorb the supply at the previous price.
For a token traded through a liquidity pool, a collection of assets used to facilitate swaps, the question is how much trading that pool can absorb. A displayed price does not mean an entire order can execute there.
This leads to slippage, the difference between the expected price and the execution price. Investopedia explains that slippage is particularly relevant when prices move quickly or liquidity is limited. It can be favorable or unfavorable.
Two related effects matter here. Your own order may move the available price; that is price impact. The market may also change between the quote and execution. Both can make the completed trade differ from the screen you first saw. Our slippage explainer explores that distinction.
A tiny market cap is not a cash reserve
Market capitalization, usually shortened to market cap, is a valuation calculation. For cryptocurrencies, it generally means the current token price multiplied by circulating supply, as described in Investopedia’s market-cap guide.
It does not measure cash sitting inside a coin. It also does not tell you how much holders could collectively receive if they tried to sell.
A trade can change the price used to value the whole circulating supply. The resulting change in headline market cap is not the same as an equivalent amount of money entering or leaving the market.
Small market cap and thin liquidity can occur together, but they measure different things. Market cap describes valuation at the current price. Liquidity describes the market’s ability to handle trades. A small valuation alone does not explain how far an order will move the price; available trading depth matters.
A hypothetical token can display an impressive-looking valuation while having limited buying interest beneath its latest price. If a seller must accept progressively lower prices, the headline valuation offers no cushion. Our guide to what market cap means and what it hides explains this common confusion.
Hype can change demand faster than the meme changes
Meme coins often draw attention through online culture, social media, and celebrity association. The Wikipedia overview of meme coins describes the importance of social momentum and the vulnerability of prices when interest fades.
Attention can create a feedback loop. People notice a rising chart, discuss it, and bring it to more people’s attention. Some observers become buyers. Their buying changes the chart again, giving the conversation fresh material.
The loop can also run in reverse. Less attention can mean fewer incoming buyers. Selling then has less demand to meet it, and a falling chart becomes the subject of conversation instead.
This does not mean every community is insincere or every enthusiastic post is coordinated. Community activity and actual buying demand are simply not interchangeable. A busy chat can contain spectators, existing holders, automated accounts, or people enjoying the meme without placing trades.
Consider a hypothetical coin whose mascot becomes a trending joke. Attention may change quickly even though the token itself has not changed. If demand depends heavily on that conversation, trading conditions can shift with it.
Concentrated holders and bots can amplify order flow
Holder concentration means a relatively small group controls a large portion of the token supply. If a large holder sells into a thin market, that order can consume available buying interest and move the price sharply.
Concentration creates uncertainty as well as immediate price impact. Other participants may react to a large transfer or sale, adding their own orders. But a wallet count alone does not establish how many independent people are involved, and a visible balance does not reveal its owner’s next action.
Bots add another layer. A trading bot is software that submits orders according to programmed instructions. A sniper is a trader or program focused on buying very near a launch. Automation describes how an order gets submitted; it does not, by itself, prove manipulation.
If several automated strategies respond to the same signal, their orders can arrive close together. In a thin market, clustered activity can produce a sharper move than the same orders spread over time. Someone viewing an older quote may encounter a different market when their transaction executes.
These mechanisms can reinforce each other. Concentrated supply, shallow liquidity, and rapid responses can amplify a move together. Our guide to bundlers and snipers covers the launch-time terminology.
Launch activity shows the scale, not a price forecast
The flow of fresh coins is another part of the setting. In the last 24 hours, as of 25 Oct 2026, 09:20 UTC, QuantBase’s own pump.fun recorder counted 20,681 launches and 839 graduations, according to its public stats.
A launch means a pump.fun coin was created within the measurement window. Graduation means a coin sold out its launch curve and moved to an open market during that window. These are activity counts, not evidence that a particular coin has durable demand.
On a bonding curve, the launch price follows a preset relationship with buying and selling. Graduation changes the trading stage; it does not remove the importance of liquidity, ownership, or incoming demand.
The launch count gives context for attention-driven markets: there is a large flow of newly created coins to inspect and discuss. It does not establish how attention is distributed among them or explain an individual price move on its own.
These windowed counts also should not be treated as a tracked group of identical coins. A coin graduating during the window may have been created earlier. The snapshot describes recorded activity, not what happens afterward.
Read the mechanics, not just the candle color
A large candle shows that the traded price changed. It does not identify the cause. The same chart shape could reflect sudden attention, a large holder’s order, limited liquidity, or several factors interacting.
A useful explanation separates three questions: What changed demand? How much trading could the market absorb? Did execution differ from the displayed quote? This keeps volatility, liquidity, and slippage from collapsing into one vague idea of a coin being wild.
Paper trading offers a way to examine a trading rule without placing a real-money trade. A journal can record the observed quote, the rule being tested, and surrounding market conditions. A simulated result remains a simulation, not proof of what a live order would receive.
For a structured exercise, test an idea on paper with QuantBase. QuantBase is a meme-coin trading app for Solana pump.fun coins; today it runs your rules on paper, with live trading coming soon. Its community is the QuantBase traders’ Telegram.
The central point: meme-coin volatility is not one mysterious force. It comes from the interaction between changing demand and a market’s capacity to absorb orders. The mascot may explain the conversation; the trading mechanics explain how that conversation reaches the chart.
FAQ
Does volatility mean a meme coin is falling?
No. Volatility concerns price fluctuations, which can include upward moves, downward moves, and repeated swings. Direction and volatility describe different things.
Is market cap the amount of money invested in a coin?
No. Crypto market cap generally multiplies the current token price by circulating supply. It is neither a record of total money invested nor a reserve available to sellers.
Why can a small trade move a meme coin’s price?
A trade can have a large effect when there is little liquidity near the current price. The order’s size relative to available trading depth matters more than whether it seems small in isolation.
Do bots cause every sudden price move?
No. Automated orders can contribute to rapid activity, but attention shifts and large manual orders can also move prices. A chart alone does not establish who traded or why.
Does graduation make a coin less volatile?
Graduation marks a move from the launch curve to an open market, not a certification of stability. Liquidity, holder concentration, and changing demand still matter after that transition.
Sources
- Volatility (Wikipedia)
- Slippage (Investopedia)
- Market capitalization (Investopedia)
- Meme coin (Wikipedia)
- QuantBase public pump.fun stats
Written with AI assistance and checked by automatic gates: every number must trace to a source above, and quotes are short. Spot an error? Tell us in Telegram.